How to Calculate Your Actual Etsy Profit From the Sold Orders CSV
You check your stats: $1,200 this month. Feels good. You post a screenshot to your seller group, call it a win, and move on.
Then — if you actually do the math — you find out you kept closer to $1,050. Still fine. But you ran three sales this month, you had a 20% coupon code floating around, and when you look listing by listing, your bestseller barely outran its fees while a listing you’d almost forgotten did most of the heavy lifting.
Revenue is the number Etsy puts front and center. It’s the number that feels good — it’s not the number that tells you whether your shop is actually working.
Here’s how to turn your Etsy Sold Orders CSV into something more useful: estimated take-home after Etsy platform fees, total fees, and a clear picture of which products are pulling their weight.
Want the faster version? Try the free CSV dashboard here →
Revenue is not profit
Here’s what Etsy shows you: order total. Here’s what you keep: order total minus Etsy’s transaction fee (6.5%), minus the listing fee ($0.20 per sale), minus payment processing (3% + $0.25), minus any discounts or shipping offsets you absorbed. (Fee rates per Etsy’s fee schedule — current as of May 2026.)
For a $20 digital product with no discount, the math looks like this:
| Transaction fee (6.5%) | $1.30 |
| Listing fee | $0.20 |
| Payment processing (3% + $0.25) | $0.85 |
| Total fees | $2.35 |
| Estimated net | $17.65 |

The gap matters more as you scale. At $1,000/month in gross sales on $20 items, you might be netting around $880. At $10,000/month, Etsy and payment fees can easily cross $1,000 — and for lower-priced digital products, the flat fees make the percentage even worse.
Note: “take-home” here means estimated net after Etsy platform fees only — transaction, listing, and payment processing. It does not include Offsite Ads, Etsy Ads spend, refunds, income tax, or your own business costs (software, design tools, etc.). For digital sellers with no production costs per sale, this is a useful starting point — not a complete picture of your expenses.
How to download your Etsy Sold Orders CSV
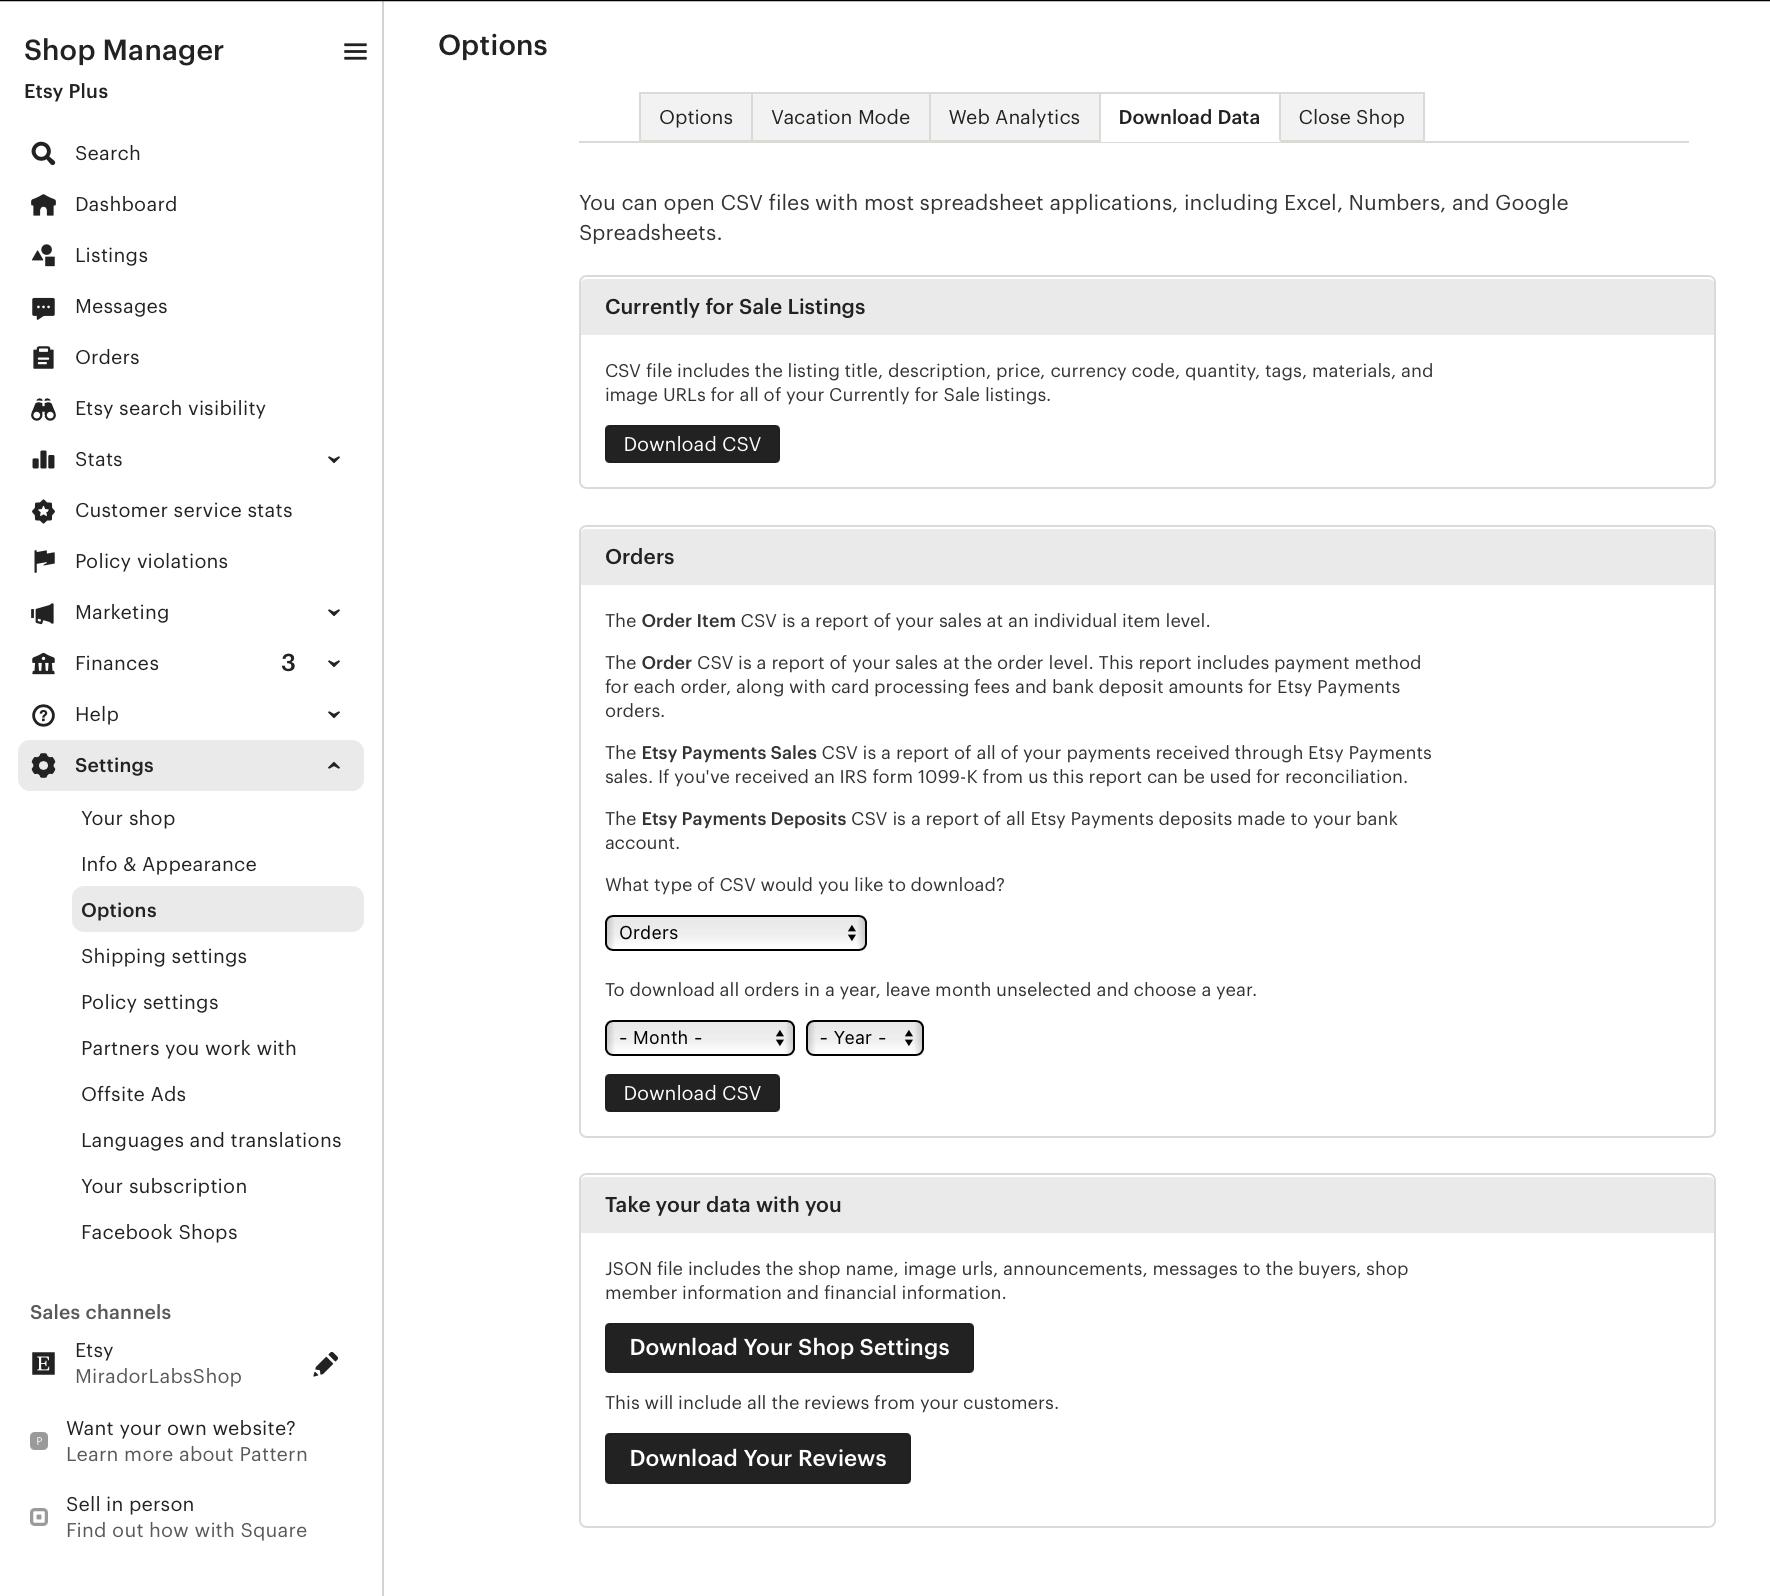
Go to Shop Manager → Settings → Options → Download Data → Orders, then select the CSV type, month, and year, and click Download CSV. That’s the file this whole guide works from.

What’s inside the CSV
The exported file includes:
- Order value — the amount the buyer paid
- Discounts — any coupon or sale reduction
- Shipping collected — what the buyer paid for shipping (often $0 for digital)
- Order net — Etsy’s pre-calculated net (useful but incomplete — doesn’t subtract all fees)
- Listing title — so you can break down by product
What it doesn’t include directly: the listing fee, the payment processing fee, or your own costs. You have to add those.
The basic profit formula
For a digital product with no physical cost, estimated profit is: order value, minus any discount applied, minus the 6.5% transaction fee, minus the $0.20 listing fee, minus payment processing (3% + $0.25).
Here’s where discounts get counterintuitive. Run a 20% sale on a $15 item and it drops to $12. The percentage-based fees shrink with the price — but the flat fees don’t move:
| Full price ($15) | 20% sale ($12) | |
|---|---|---|
| Transaction fee | $0.98 | $0.78 |
| Listing fee | $0.20 | $0.20 |
| Payment processing | $0.70 | $0.61 |
| Total fees | $1.88 | $1.59 |
| Estimated net | $13.12 | $10.41 |
That’s $2.71 less per order — not just from the discount, but because the flat fees now claim a bigger slice of a smaller pie.
One more fee that could be eating your margin right now: Offsite Ads
Here’s something most sellers don’t find out until they look at their CSV closely: if your shop has crossed $10,000 in lifetime sales, Etsy automatically enrolls you in Offsite Ads. That means Etsy charges an extra 12–15% on any sale they attribute to an Offsite Ad — on top of the standard fees. And you can’t opt out.
On a $20 sale, that’s an additional $2.40–$3.00 gone. Combined with the standard fees, you could be keeping less than $14 from a $20 sale on those orders.
To check if this applies to you: go to Shop Manager → Marketing → Offsite Ads. If you see a percentage listed and the toggle is greyed out — you’re enrolled and it’s mandatory.
To spot these orders in your CSV: look at the “Order Net” column. Orders where Etsy charged an Offsite Ads fee will show a lower net than your formula would predict. Those are the ones Etsy already adjusted down before you even saw the number.
The 5 metrics worth tracking first
Once you have your CSV, these are the numbers that actually drive decisions:
1. Net revenue — gross sales minus all fees and discounts. This is your real revenue number.
2. Etsy Fees — the absolute dollar amount leaving your shop in fees. Knowing this number prevents the “but I’m making money” illusion.
3. Fee rate — total fees ÷ gross revenue. For most digital sellers this runs 12–15%. If yours is higher, check whether you’re running frequent sales or your prices tend to be on the higher side.
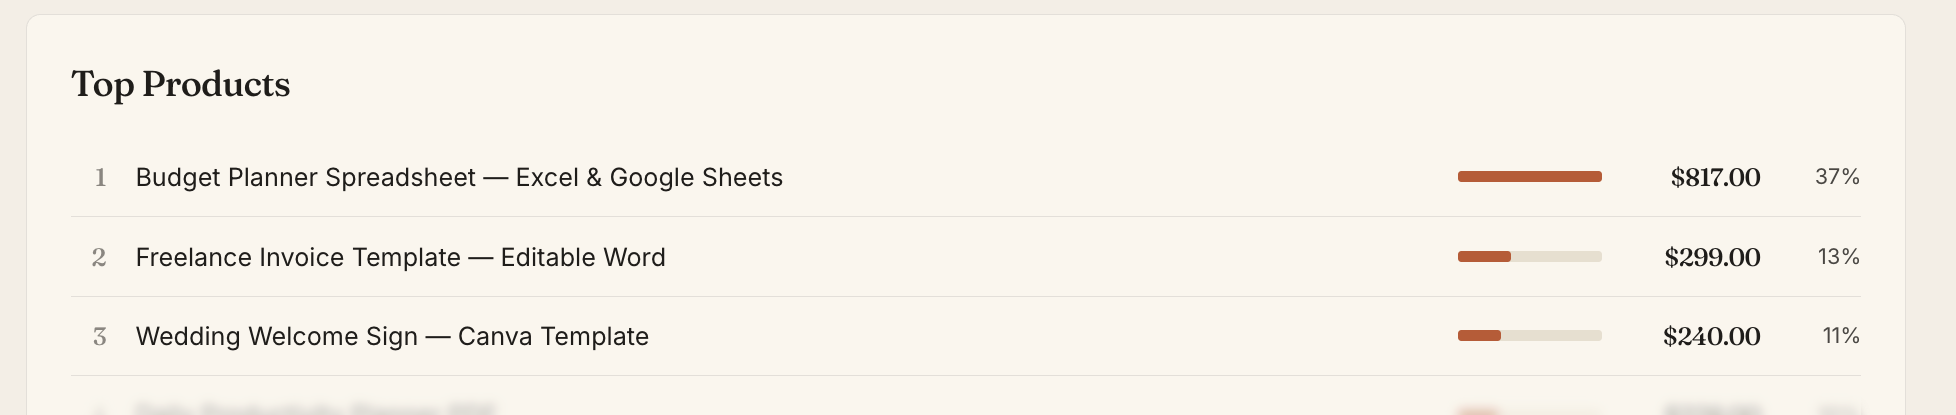
4. Top products by net revenue — not by order count. Your bestseller by volume might not be your best earner. The CSV lets you see this clearly once you group by listing title.
5. Revenue trend — the trend matters more than any single month. A flat or declining trend is information. An accelerating one tells you something is working. To see it: download CSVs for two or three consecutive months and compare net revenue side by side.
What to do with the numbers
Once you can see what each product actually earns, here’s how to decide what to do:
- Keep and protect — high margin, consistent demand. Don’t discount these.
- Improve or reposition — selling okay, but not earning much per sale — usually because of heavy discounting or a price that doesn’t leave room after fees.
- Promote — high margin but low volume. Worth putting budget or visibility behind.
- Sunset — low earnings and low demand. The listing fee alone costs $0.20 every time it renews.
This is where the data stops being interesting and starts being useful.
A faster way to see all of this
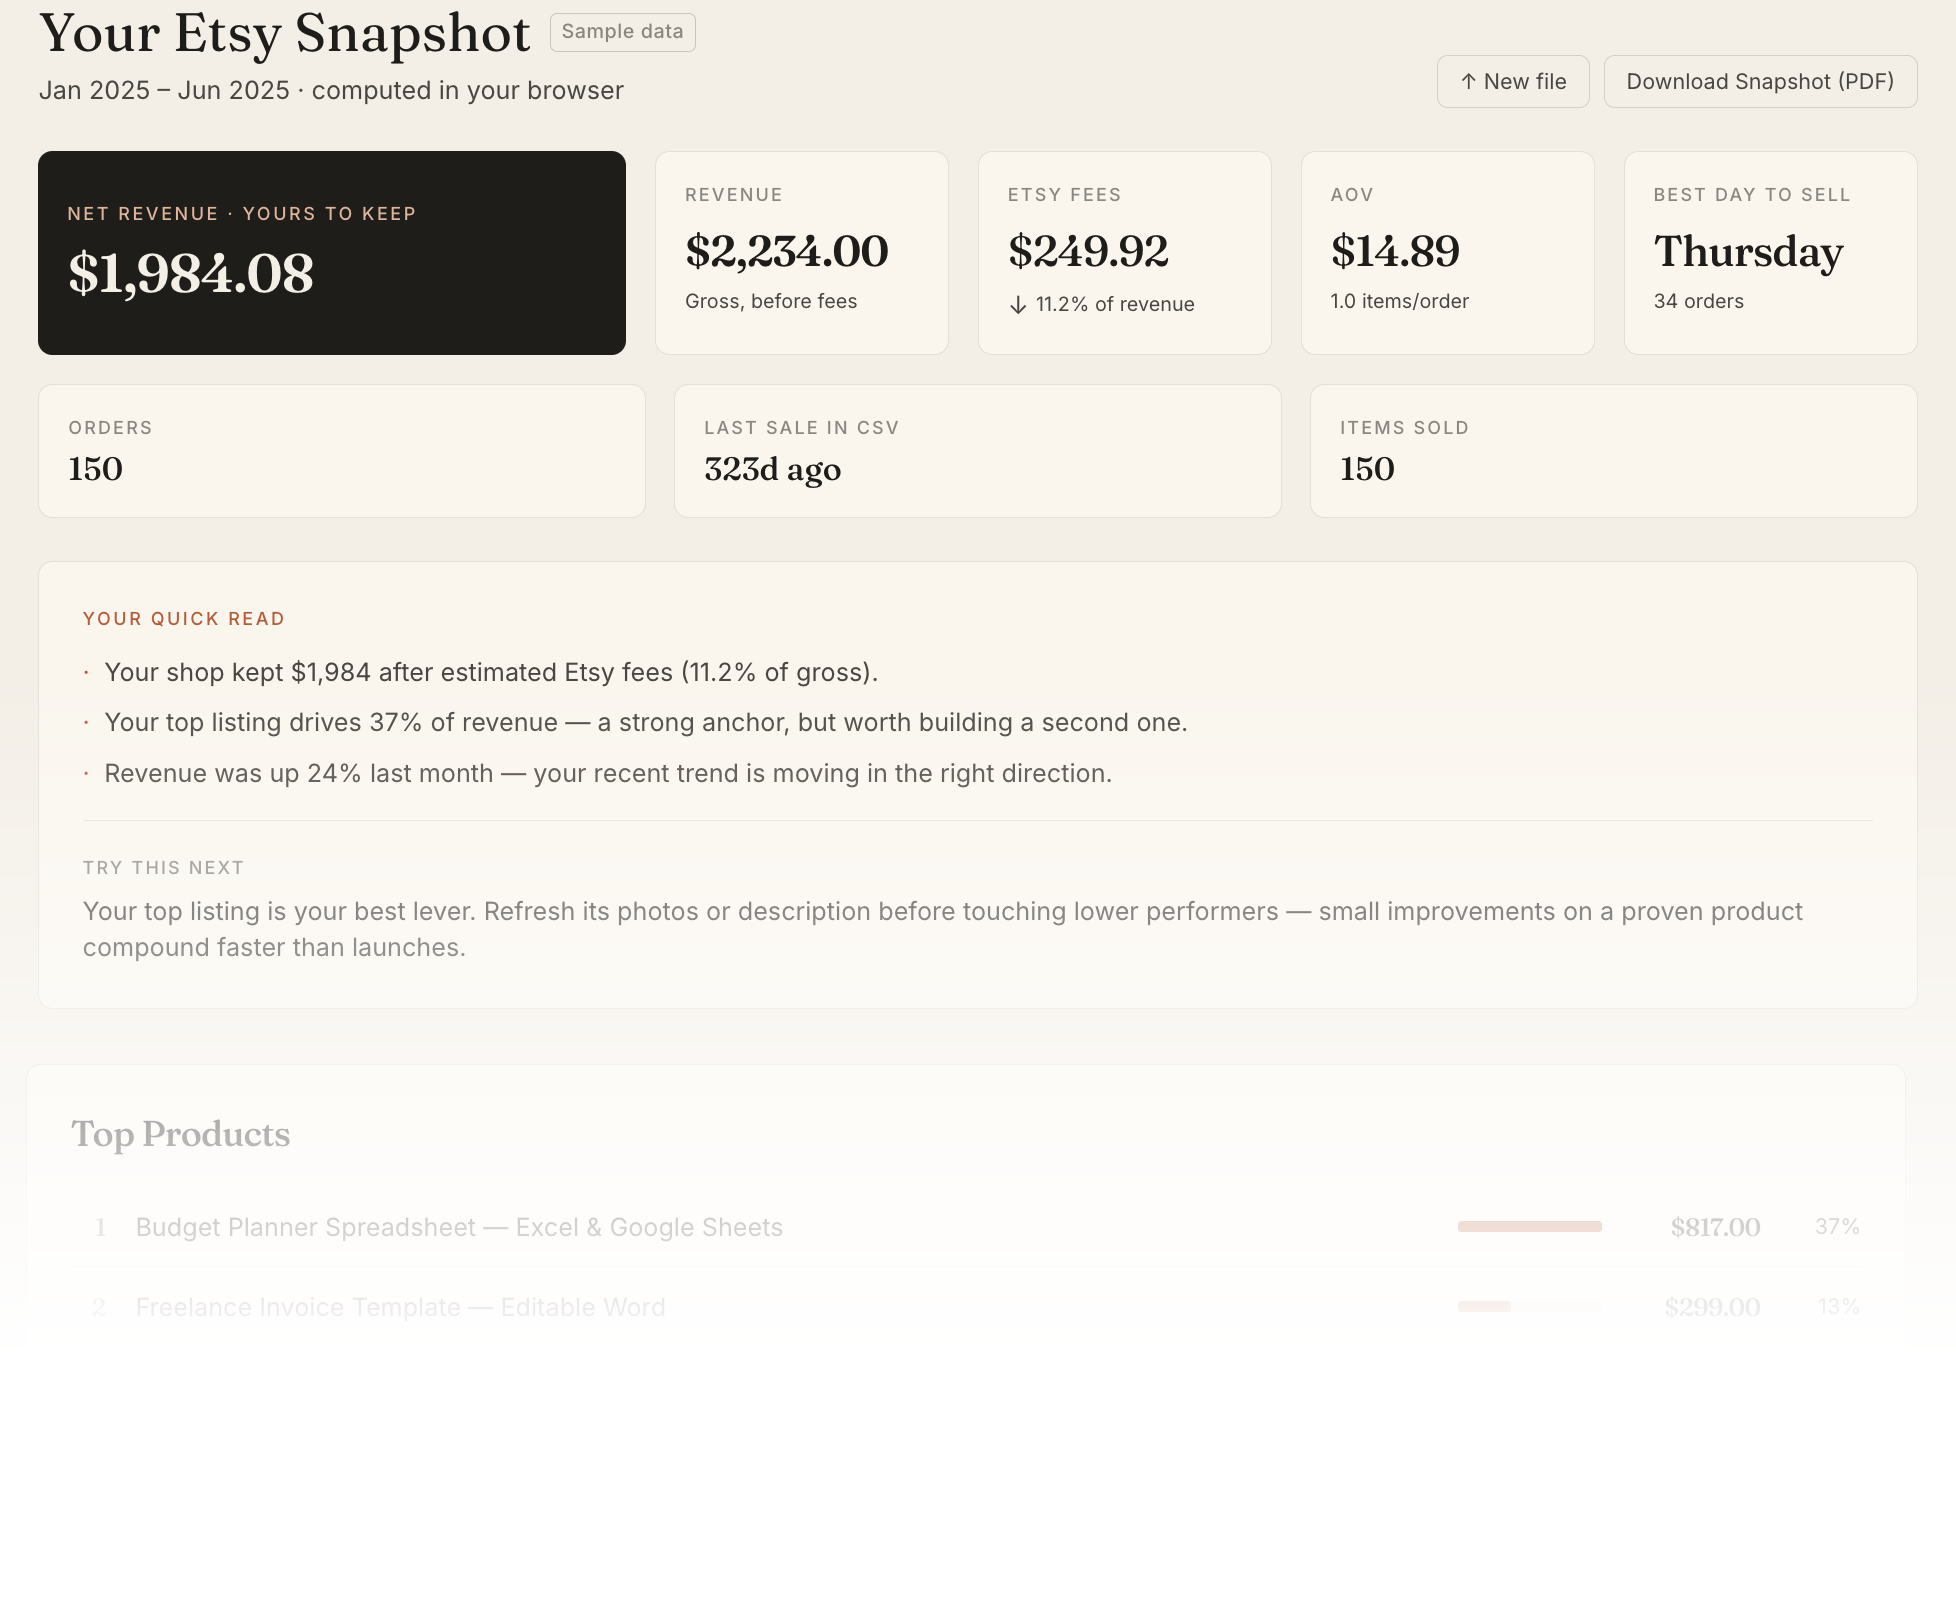
If the formulas are more than you want to rebuild every month, that’s what the MiradorLabs free dashboard is for — drop your CSV in your browser, see your real numbers in about 30 seconds. Net revenue, Etsy Fees, top products, day-of-week breakdown. Nothing leaves your device. Here’s a full walkthrough of what it shows →
If you’re pulling your CSV every month and running these numbers regularly, the Excel Dashboard is designed for that workflow: a saved workbook you upload once and reuse month to month, with recommended actions per listing, estimated profit after your own expenses, a tax set-aside calculation, and custom fee settings. One-time purchase, yours forever, no subscription.
MiradorLabs builds clear analytics tools for small shops. No account required, and your CSV stays in your browser.
Try it on your own Etsy data.
Drop your Sold Orders CSV and see your estimated net revenue, fee load, and top products — free, in your browser, in about 30 seconds. Nothing leaves your device.
- Free
- No account required
- CSV stays in your browser
Want the monthly dashboard when it launches?
Join the list and I'll send one email when it's ready.
No spam. Your email is only used for MiradorLabs updates. Privacy policy.