Free Etsy Profit Dashboard for Sold Orders CSV
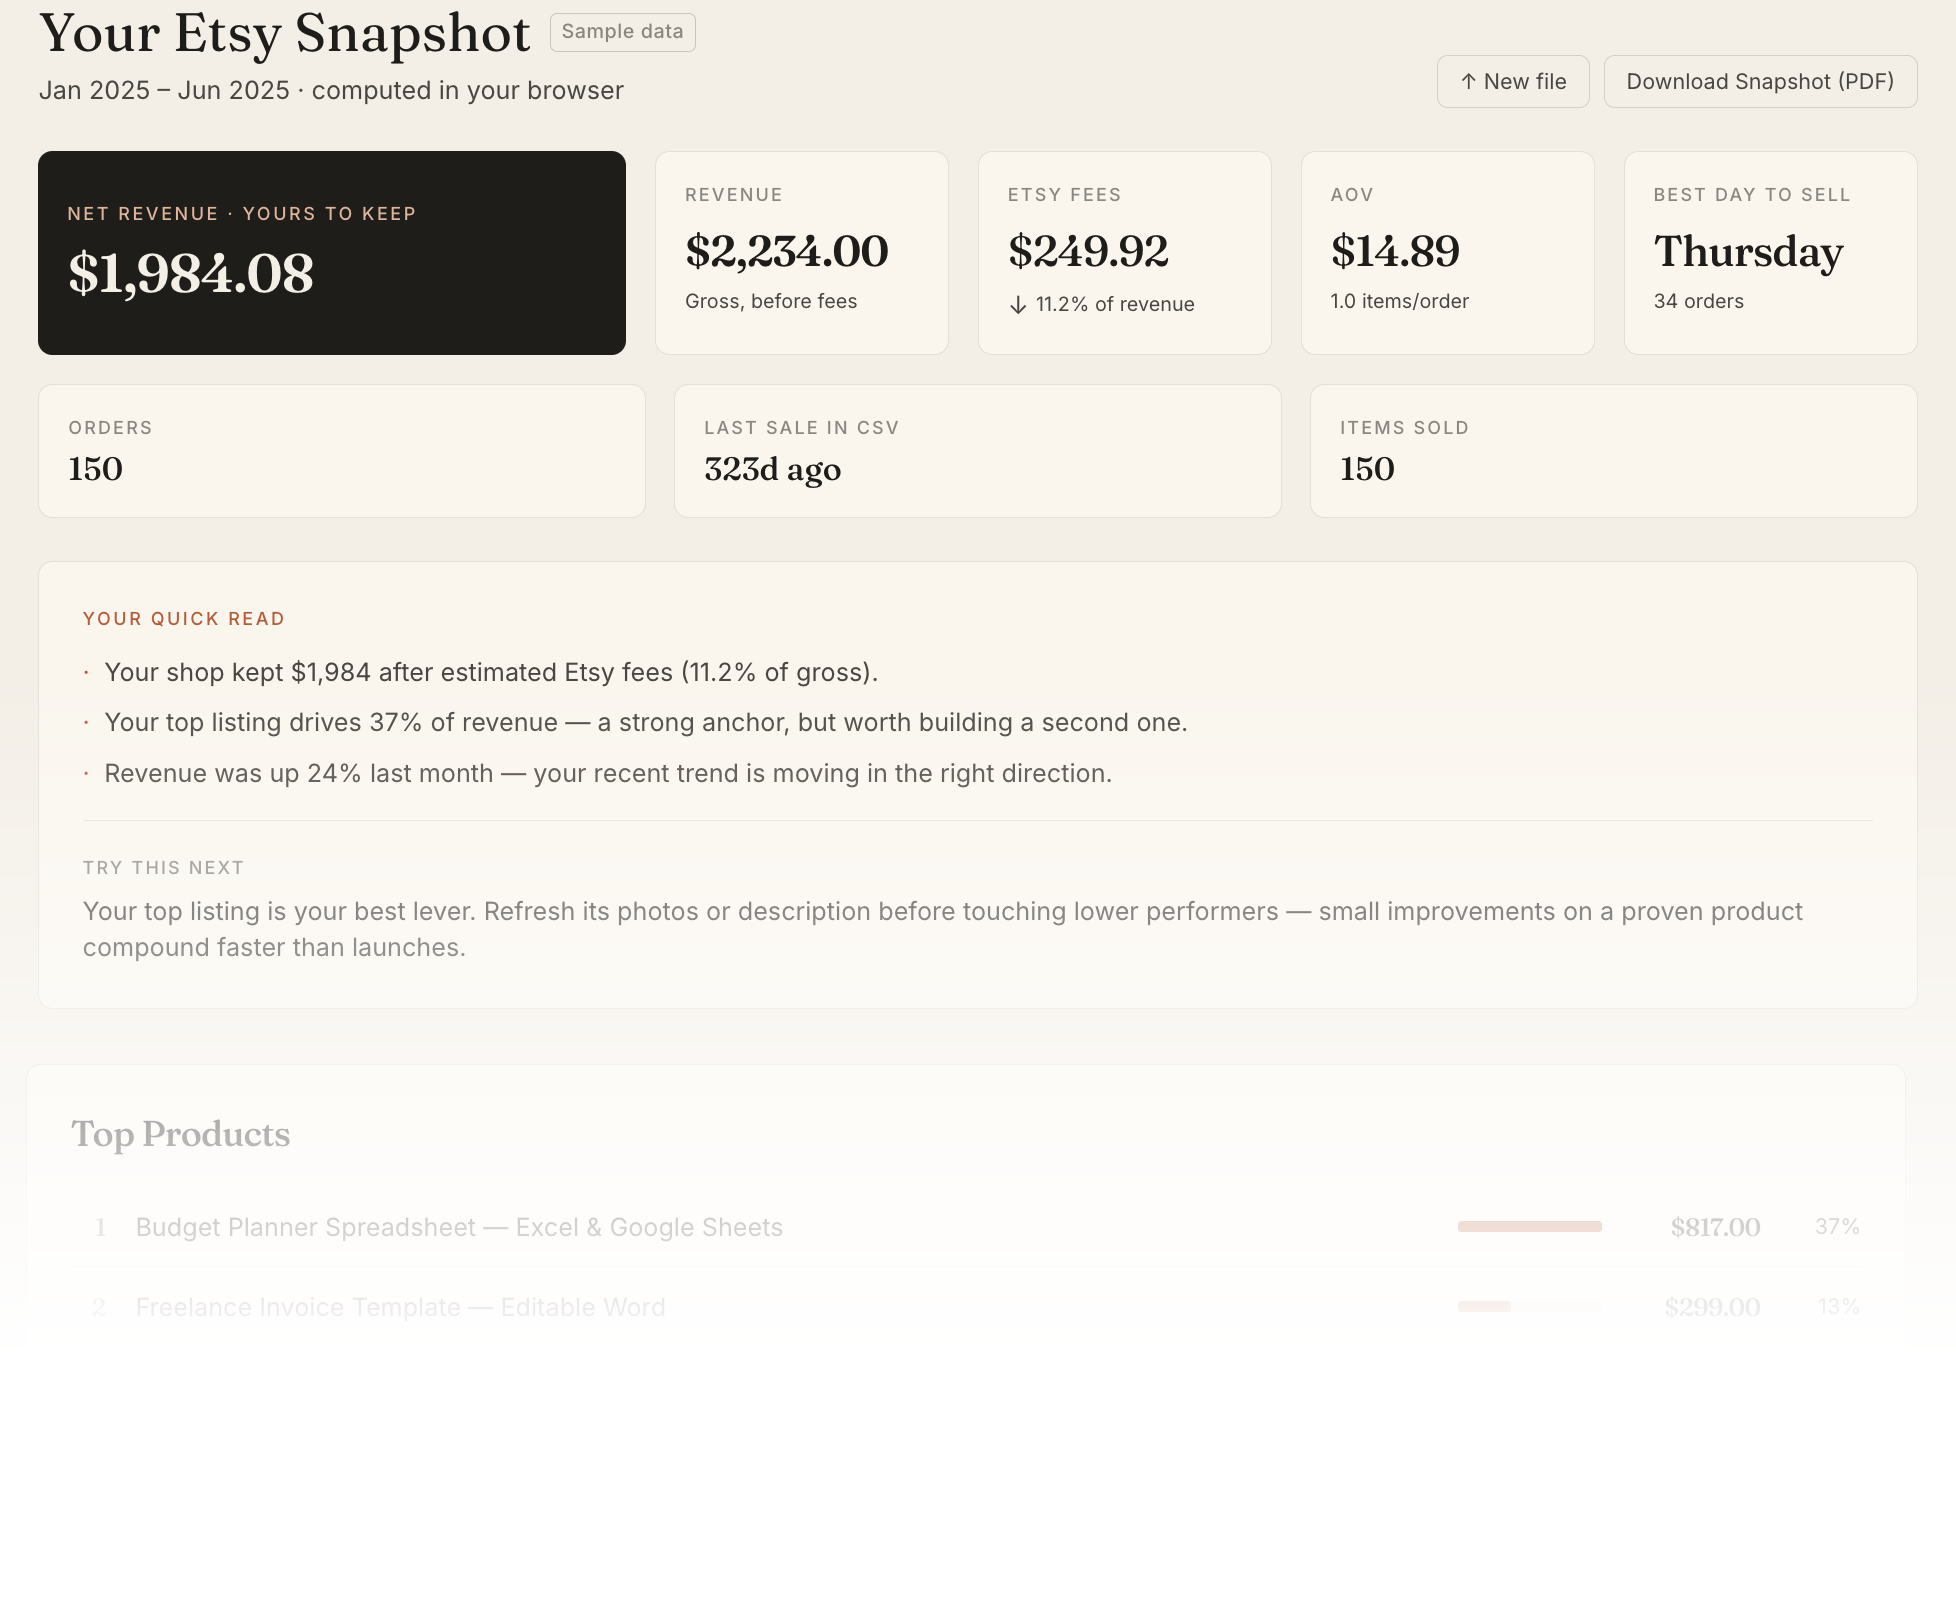
You know what Etsy made. You don’t know what you kept. This dashboard shows you the difference — estimated net revenue after standard Etsy and payment fees, so you can see what you actually walked away with, not just what sold.
Upload your Sold Orders CSV and you’ll see Etsy Fees, your top products, best sales day, and a plain-language read of what’s happening in the shop. No account required. No login. Your CSV stays in your browser — the file itself is not uploaded or stored.
Best for: Etsy digital product sellers, printable shops, template sellers, and small shops that want a quick monthly read from their Sold Orders CSV.
Not built for: full bookkeeping, tax filing, ad attribution, inventory, or physical-product cost tracking.
What it shows
Net Revenue — gross sales minus estimated standard Etsy and payment fees (transaction, listing, and payment processing). A more actionable number than gross revenue, though not a complete profit figure.
Etsy Fees — the dollar amount and percentage leaving your shop. Many US digital shops without ads land around 12–15%. If yours is higher, the dashboard will flag it.
Average Order Value — useful for spotting whether a discount period pulled your floor down.

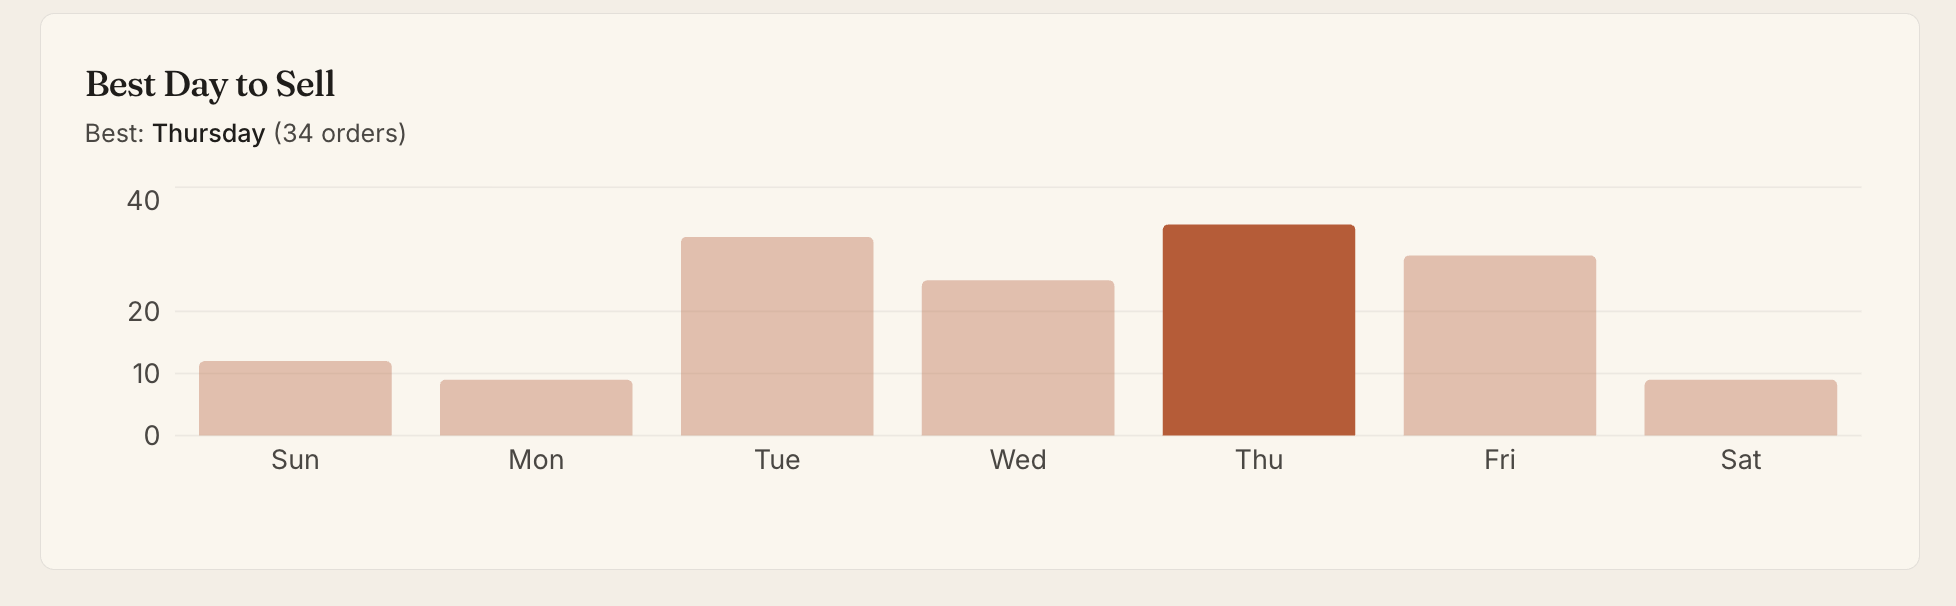
Best Day — which day of the week generates the most orders. Useful before timing a promo or listing drop.
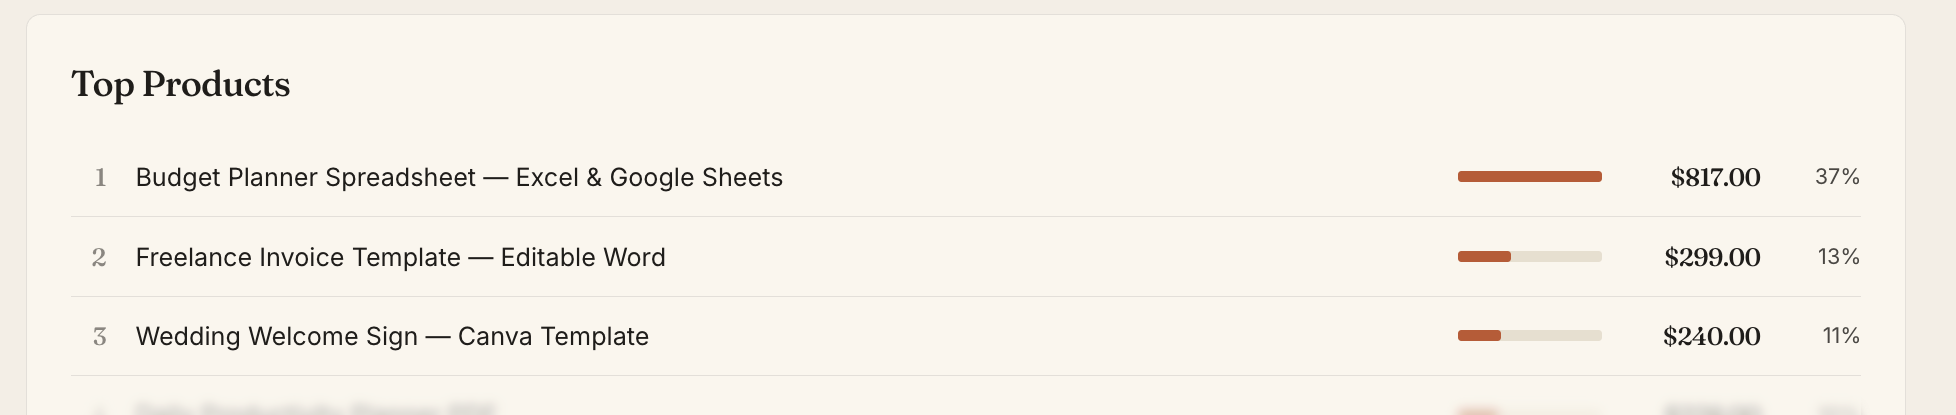
Top Products — ranked by revenue with share percentage. Your bestseller by order count is often not your best earner.
Your Quick Read — three auto-generated sentences: fee rate context, concentration risk, and month-over-month trend. Calculated from your data, not placeholder copy.

Try This Next — one action recommendation based on where your revenue is concentrated.

How to use it
Step 1: Export your CSV from Etsy
Go to Shop Manager → Settings → Options → Download Data → Orders. Select the CSV type, month, and year, then click Download CSV. For a fuller trend view, export a full year by leaving the month blank, or use a CSV with a broader date range if available.
Step 2: Upload
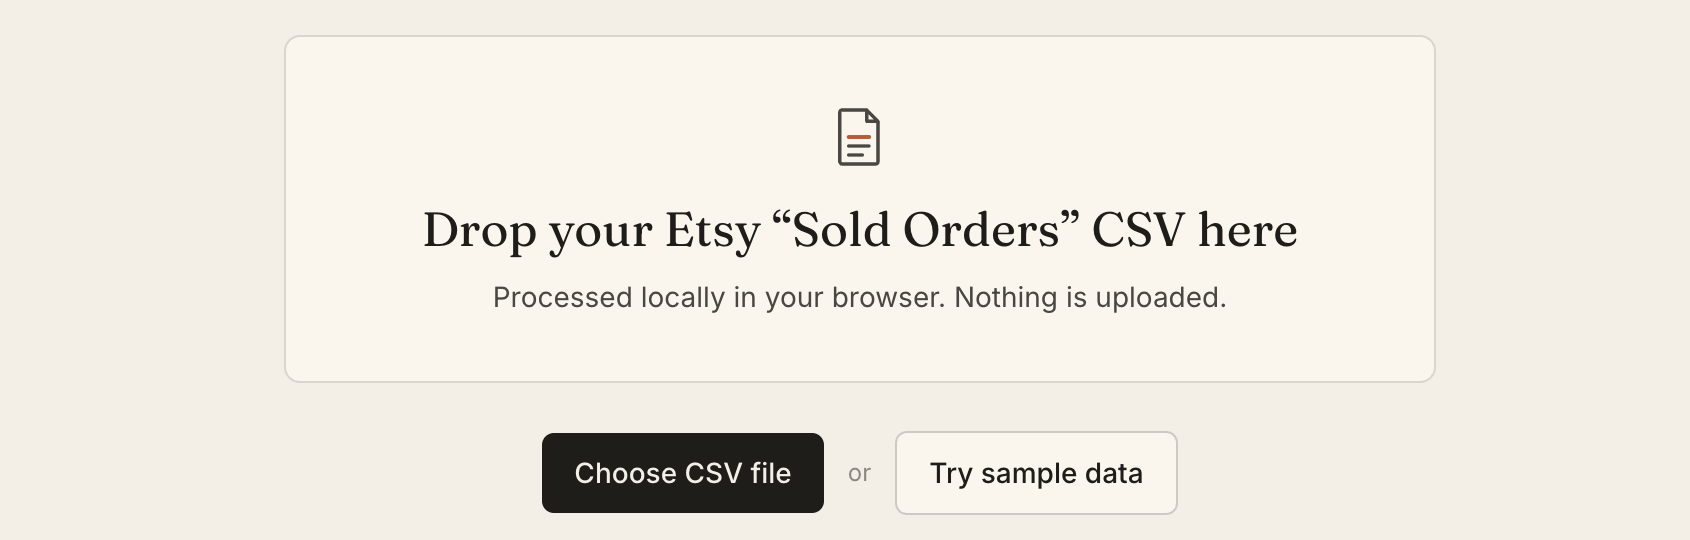
Drag the CSV into the dashboard or click to browse. No account, no signup — your data goes directly into the browser.
Step 3: Read your numbers
The dashboard loads in a few seconds. Net revenue is the first thing you’ll see, then the full breakdown below it.
The email unlock is optional. The core dashboard works without it. If you do enter your email, only the email address is submitted — your CSV data stays in your browser either way. Entering your email unlocks the expanded product view (top 5 instead of 3) and a Shop Focus Insight on concentration risk.
What it doesn’t do
It doesn’t include every cost. Net revenue here means after standard Etsy and payment fees — transaction (6.5%), listing ($0.20 per sale), and payment processing (currently estimated at 3% + $0.25 for US Etsy Payments sellers). (Fee rates per Etsy’s fee schedule — current as of May 2026.) Offsite Ads fees, Etsy Ads spend, refunds, income taxes, business expenses, and your own product costs are not included. For digital products with no per-unit cost, it’s a useful monthly read. For shops with significant ad spend or physical goods, treat it as a starting point.
It doesn’t connect to Etsy directly. No API integration, no linking your account. You export the CSV manually and upload it. That’s by design — your data stays with you.
It doesn’t save anything. Close the tab and the session is gone. Every visit is a fresh upload.
It doesn’t replace bookkeeping. This is a monthly clarity tool, not an accounting system.
FAQ
Is it really free?
Yes. The core dashboard — KPI band, Top Products, quick read, best day — is free with no account required. The email unlock is optional. The core dashboard works without it.
Does my data leave my browser?
No. The CSV is parsed locally in your browser. Your CSV data is not sent to a server or stored anywhere. If you enter your email for the optional unlock, only the email address is submitted — not your CSV data.
What CSV does Etsy give me?
The Sold Orders CSV from Shop Manager → Settings → Options → Download Data → Orders. It includes order value, discounts, shipping collected, order net, and listing title — everything the dashboard needs.
Can I upload multiple months at once?
Yes. The dashboard handles CSVs with any date range. A broader date range gives you better trend data.
What does the Excel Dashboard add?
Use the free dashboard for a quick monthly read. Use the Excel Dashboard when you want to track decisions over time. It adds Recommended Actions per listing, estimated profit after your own expenses, a tax set-aside calculation, and custom fee settings. One-time purchase, yours to reuse every month — no subscription.
MiradorLabs builds clear analytics tools for small shops. No account required — your CSV stays in your browser.
Try it on your own Etsy data.
Drop your Sold Orders CSV and see your estimated net revenue, fee load, and top products — free, in your browser, in about 30 seconds. Nothing leaves your device.
- Free
- No account required
- CSV stays in your browser
Want the monthly dashboard when it launches?
Join the list and I'll send one email when it's ready.
No spam. Your email is only used for MiradorLabs updates. Privacy policy.